This is the traffic overview of the Attack Studios website for June 2021. I got this tip to do this kind of post from Pat Flynn after reading his book Superfans https://patflynn.com/book/superfans/
Attack Studios Performance for the Month of June:
Total Clicks 898
Total Impression 57.3K
Average CTR (Click Thru Rate): 1.6%
Average Position: 37.6
Users: 2K (down 11.2%)
Sessions: 2.2K (down 10.6%)
Bounce Rate: 80.22% (up 7.3%)
Session Duration: 40s (up 15.2%)
Goal Completions: 26
Goal Conversion: 4.09%
1,042 People viewed your Business Profile
538 Searches triggered your Business Profile
I couldn't find my charts like I did last month, not sure how I did that so easy before TBH!
GOALS:
This month was down a lot compared to last month, by almost 1.5K users, but I had 4 business profile interactions and 4 calls from it (so I'm up by 1). I also feel like I've had a bunch more inquiries in general in June for July and August bookings. There were at least 7 additional inquiries, some resulting holds/booking, and other opportunities.
Reel plays were only 25, down a staggering 50 from last month when I was at 75. I definitely fell short of my 100 reel play goal per month. What I'm learning from this practice so far is there might not be a huge benefit in comparing month to month as much as comparing June this year to June last year. It seems like the buying/interest cycle is stronger at the beginning of a quarter than it is in the middle. That's something to keep an eye on for sure.
Notes:
I spent around $200 or so on SEO this month. I was a little late in starting my main SEO and I tried something new with a backlink-centric service as well. I posted twice:
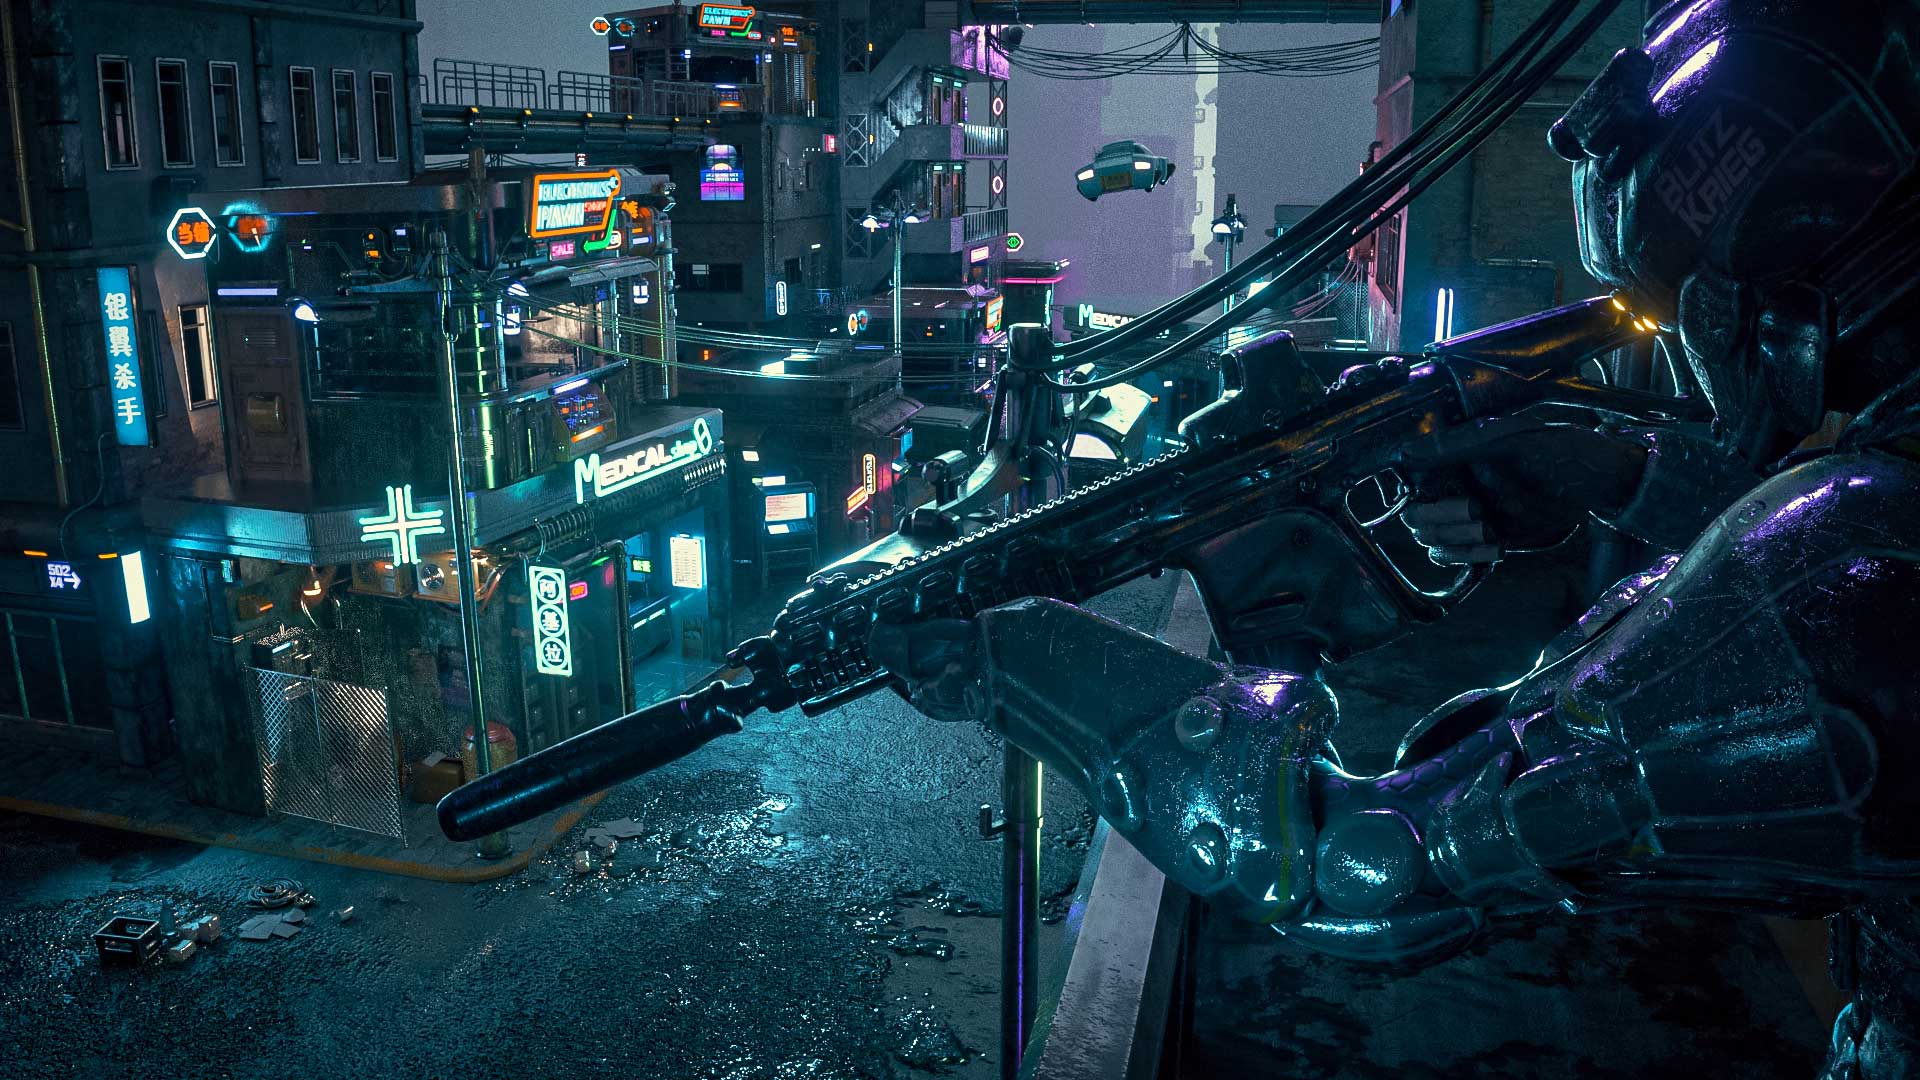
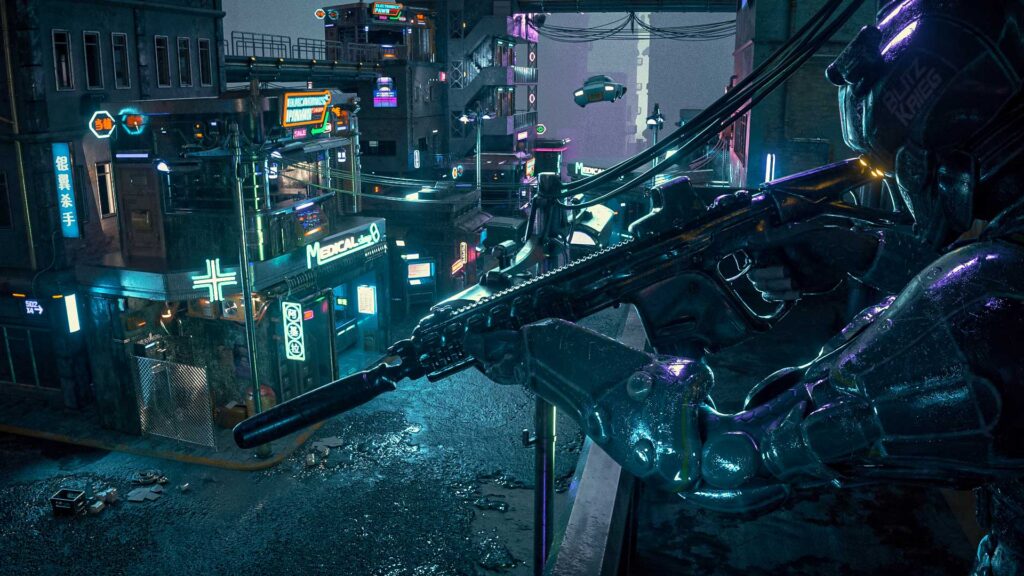
I posted this photo to my Google My Business Page as a cover and it got 222 views in two weeks. I posted 17 other photos as well, more 3D renders from the class I was working on.
The runner-up was a little Gonk Landscape foggy at night with 49 views.


No comments.